Point in Time Count
2022 Homeless Point-In-Time Count Report
Every two years, the US Department of Housing and Urban Development (HUD) requires communities to conduct a Point-in-Time (PIT) Count of individuals, youth, and families experiencing homelessness and provide specific data about their demographics and characteristics. On Wednesday, February 23rd, 2022 Alameda County conducted this count, which includes those who are forced to sleep outdoors, in vehicles, tents or makeshift structures as well as a count of people residing in shelters, transitional housing and safe parking programs. In the weeks following the count, a random, sample survey is also conducted with those experiencing sheltered and unsheltered homelessness to learn more about the demographics, experiences, and needs.
Information regarding the 2022 Point in Time Count can be found using the following links:
- 2022 Alameda County Homeless Count and Survey Comprehensive Report and Methodology
- Executive Summary Infographic
- Interactive Data Dashboard
- Data Resource Guide
2019 Homeless Point-In-Time Count Report
Project Roomkey: Operation Safer Ground Data
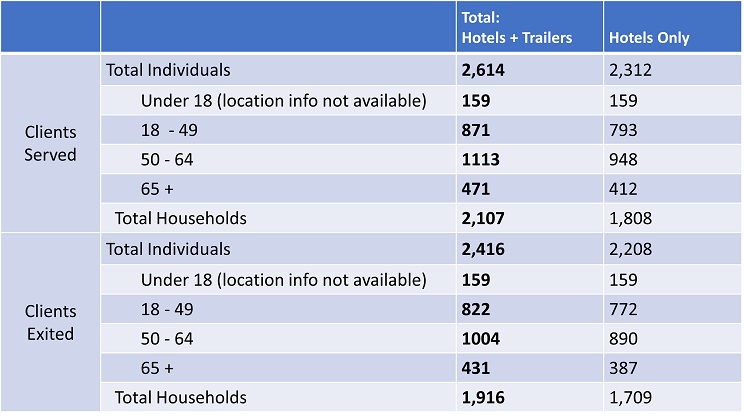
Project Roomkey: Final Operation Safer Ground Data
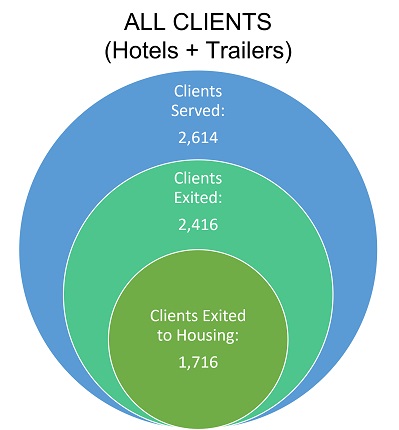
Safer Ground: Details of Clients Served and Exits
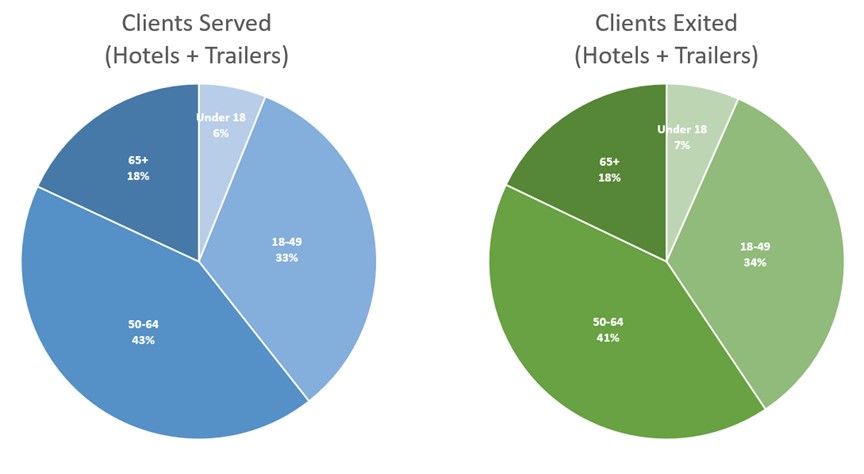
Safer Ground: Ages of Clients Served and Exited
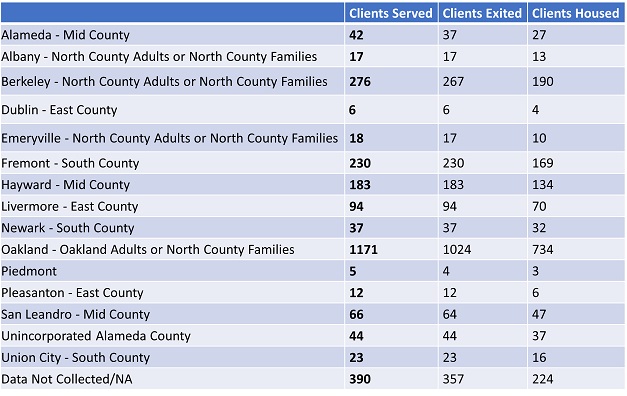
Safer Ground: Clients Served and Exits by Home City
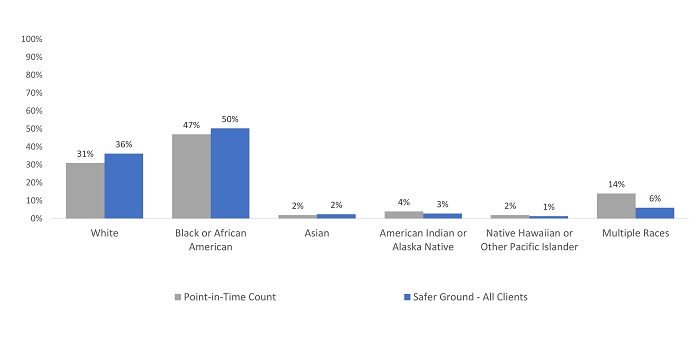
Safer Ground: Demographics - Race
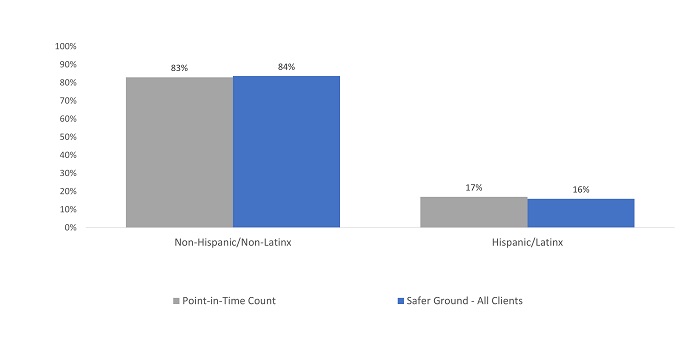
Safer Ground: Demographics - Ethnicity
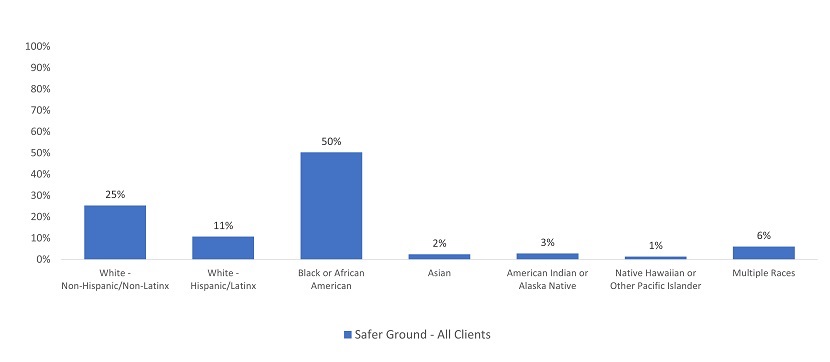
Safer Ground: Demographics – Combined Race and Ethnicity*
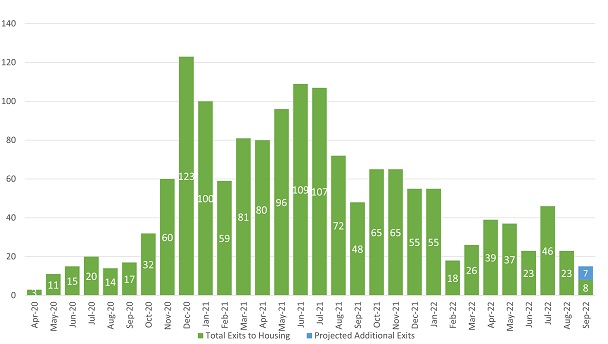
Operation Safer Ground: Monthly Exits to Housing
Links to Additional Data
- NEW Alameda County HMIS website now live! HMIS is a database that tracks homeless individuals and families, allowing service providers to share data and coordinate services. Learn more here.
- Centering Racial Equity in Homeless System Design